Critical issues caused by incomplete test coverage? Unclear which features your changes might affect? Struggling with complex OOP architectures, table relationships, or deciding where a new ABL class or interface belongs?
Reading code is great—but sometimes, a visual tells the story faster, right?
That’s exactly where CrossWay, the 4GL Code Analysis Tool, comes in.
A custom-built 4GL code analysis tool designed specifically for Progress OpenEdge applications—created to solve these very challenges.
CrossWay gives you a clear visual map of how your changes impact the entire application, so you’re never left guessing. By analyzing cross-references in your 4GL code and database structure, it generates intuitive, easy-to-read diagrams that reveal dependencies, relationships, and potential risks.
Whether you’re dealing with complex OOP logic, uncertain table links, or tight release requirements, CrossWay brings clarity where it’s needed most.
Connecting the Dots, So You Don’t Have To
CrossWay addresses all the challenges by translating complex 4GL code into clear, actionable visual diagrams—making both development and testing significantly more efficient.
Understanding the impact of your code changes beforehand enables your QA team to accurately estimate the testing effort and focus on what really matters.
CrossWay—4GL Code Analysis Tool supports several visual representations for analyzing the technical and functional impact of any code change, large or small, helping reduce the risk of releasing inconsistent functionality. Currently, the tool offers Impact, Inheritance, and Interface diagrams, with additional views such as the Sequence Diagram, Table Relations Diagram, and Package Model Diagram actively in development—designed to deliver the most insightful and powerful features for comprehensive code understanding.
Every Diagram Tells a Story
Impact Diagram
The Impact Diagram offers a clear, visual way to explore how one file influences others across your codebase. By selecting a specific file in the project, like StageBE.cls, you can instantly map out all dependencies—whether they lead to or from that file—using forward, backward, or full traversal.
Choose between a simple view or a detailed one, customize depth, filter by reference types (like new, inherits, DB access, etc.), and see exactly how your files are connected. Whether you use draw.io or the CrossWay Diagram Viewer, generating and exploring relationships is intuitive and flexible.
Interface Diagram
The Interface Diagram offers a visual overview of how interfaces are implemented throughout your codebase. When starting from a class, the diagram will display all interfaces that the class implements, as well as all other classes that implement those same interfaces. This helps you quickly understand shared behaviors and architectural patterns across multiple components.
If the diagram is generated starting from an interface, it will display only the classes that directly implement that specific interface—giving you a focused view of its concrete usage in the system.
Inheritance Diagram
The Inheritance Diagram builds a clear, tree-like view starting from a chosen class, showing all the inheritance relationships connected to it. This allows you to easily see which classes inherit from the starting point and how the hierarchy spreads across your codebase.
By mapping these inheritance links, the diagram makes it simple to understand class lineage, identify base and derived classes, and spot architectural patterns that rely on inheritance.
Visualize to Optimize
Visualizing the impact of code changes is a game-changer when it comes to speeding up analysis and refactoring. Instead of digging through lines of code or complex database schemas, visualization offers a clear, intuitive picture of how different parts of the system connect and interact. This natural insight helps developers understand not only how the code flows, but also how database tables relate to one another—making it easier to spot potential issues and plan improvements confidently. By bringing the invisible relationships to light, visualization transforms a tedious, error-prone process into one that’s faster, smarter, and more reliable.
Sneak Peak
Impact Diagram
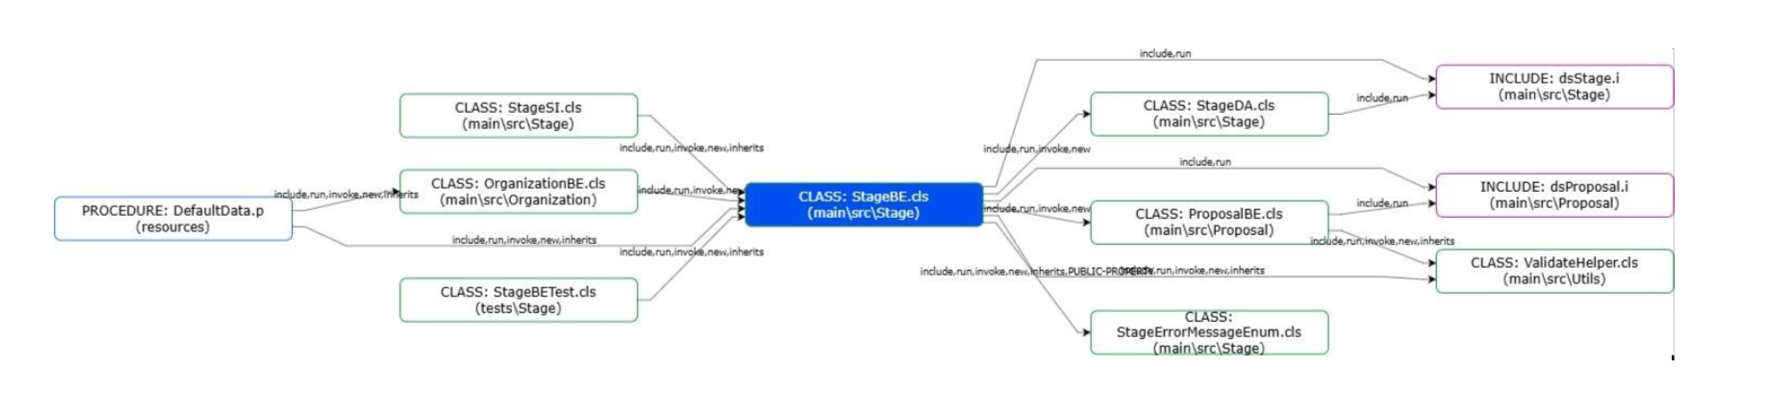
Here, StageBE.cls sits at the center of a complex dependency web — it includes datasets and invokes several classes, modules, and helpers across different packages (Stage, Proposal, Utils, etc.).
Visualizing all include/invoke paths uncovers tight coupling and cross-package dependencies — critical for refactoring, testing boundaries, or even migration planning.
Interface Diagram
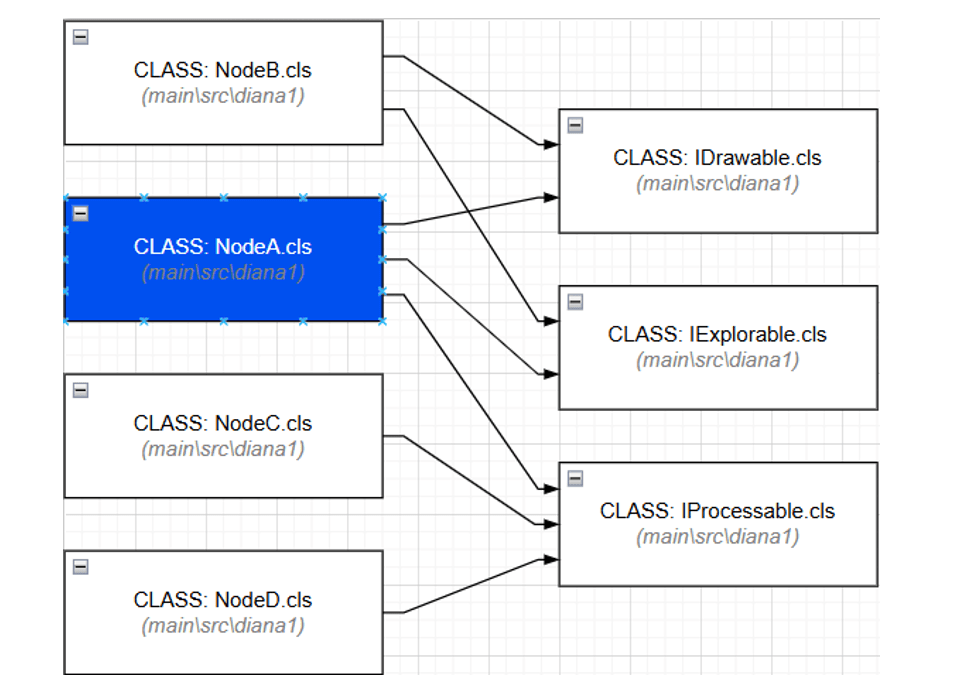
This diagram maps out how multiple Node classes (A–D) implement shared behavior across three interfaces: IDrawable, IExplorable, and IProcessable.
It instantly reveals architectural consistency — we can see which classes align with expected capabilities and spot any gaps (e.g., a class missing an interface). It’s also helpful for assessing coupling to interface contracts.
Inheritance Diagram
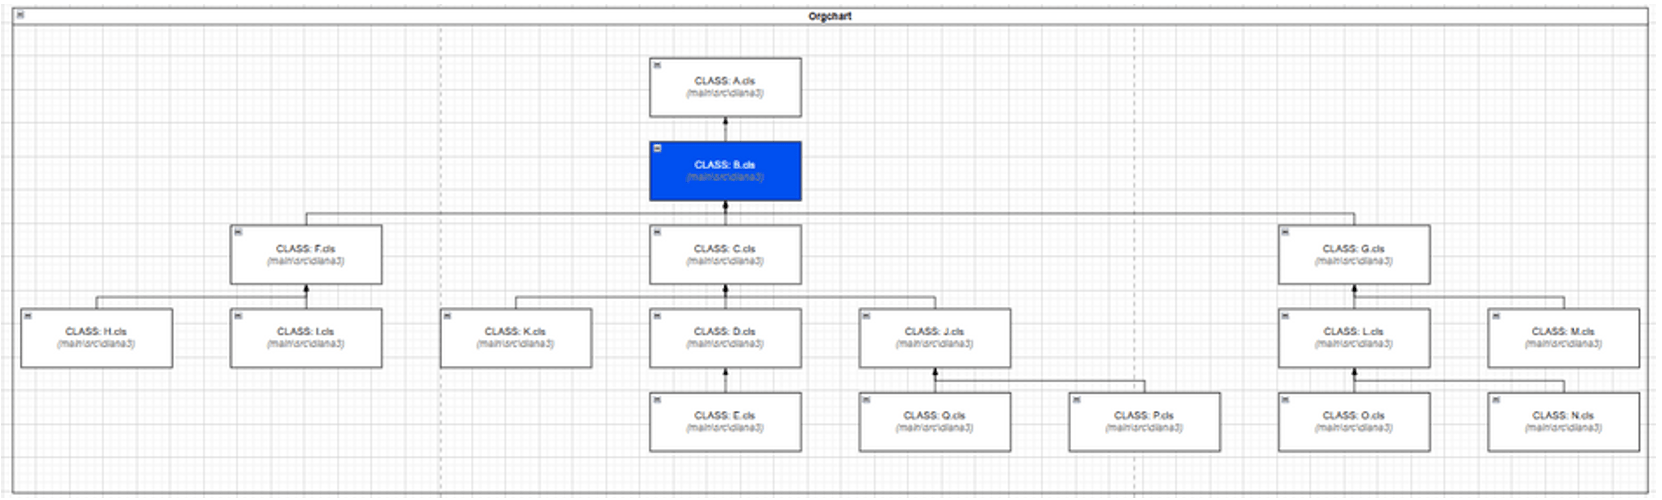
This “OrgChart” style view captures class inheritance hierarchies. Here, B.cls inherits from A.cls, and in turn, has multiple child classes such as C.cls, D.cls, and G.cls.
Inheritance trees can become deep and tangled. This visualization helps keep them navigable and maintainable, especially when reasoning about polymorphism or method overrides.
Are you curious to see how these diagrams were generated?
CrossWay parses your codebase, traces dependencies, and turns structure into visuals — instantly.
CrossWay: 4GL Code Analysis Tool | Enhancing Code Quality

Author: Diana Serban, Junior Developer
She is a dedicated and responsible individual, always ready to lend a helping hand. Her motivation and reliability make her a trusted presence in any team or project she undertakes.